
02 · The assessment method
Pocket and street
What is the suburb median hiding about this position?
Two homes can share a postcode and face different demand because the street, slope, outlook, noise and walking routes are different. Pocket analysis helps locate those differences. The work is then to decide whether the market is pricing a temporary gap or a permanent compromise.
What Ben examines
- Traffic, noise, topography, aspect, outlook and the immediate streetscape
- Walking routes to transport, schools, shops and the amenities the buyer will actually use
- Planning, bushfire, flood, heritage and other constraints at the address
- Recent like-for-like sales within the immediate pocket
- The historical performance of small groups of nearby homes compared with the suburb
How to read it
Ben may compare micro-pockets of roughly 120 homes to see where recorded performance has diverged.
A lagging pocket may be overlooked, or it may carry a compromise the market will continue to discount.
Buying below a pocket median is not automatically buying below value. The reason for the lower price matters.
What the pocket maps show
One suburb can contain very different ten-year results.
Each outlined area represents a small group of nearby homes. The dollar figure is the median house price for that pocket. The percentage is its recorded growth over the preceding ten years.
In both examples, the spread between pockets exceeds 100 percentage points. That is why a suburb-wide growth figure is not enough to judge a street or property.
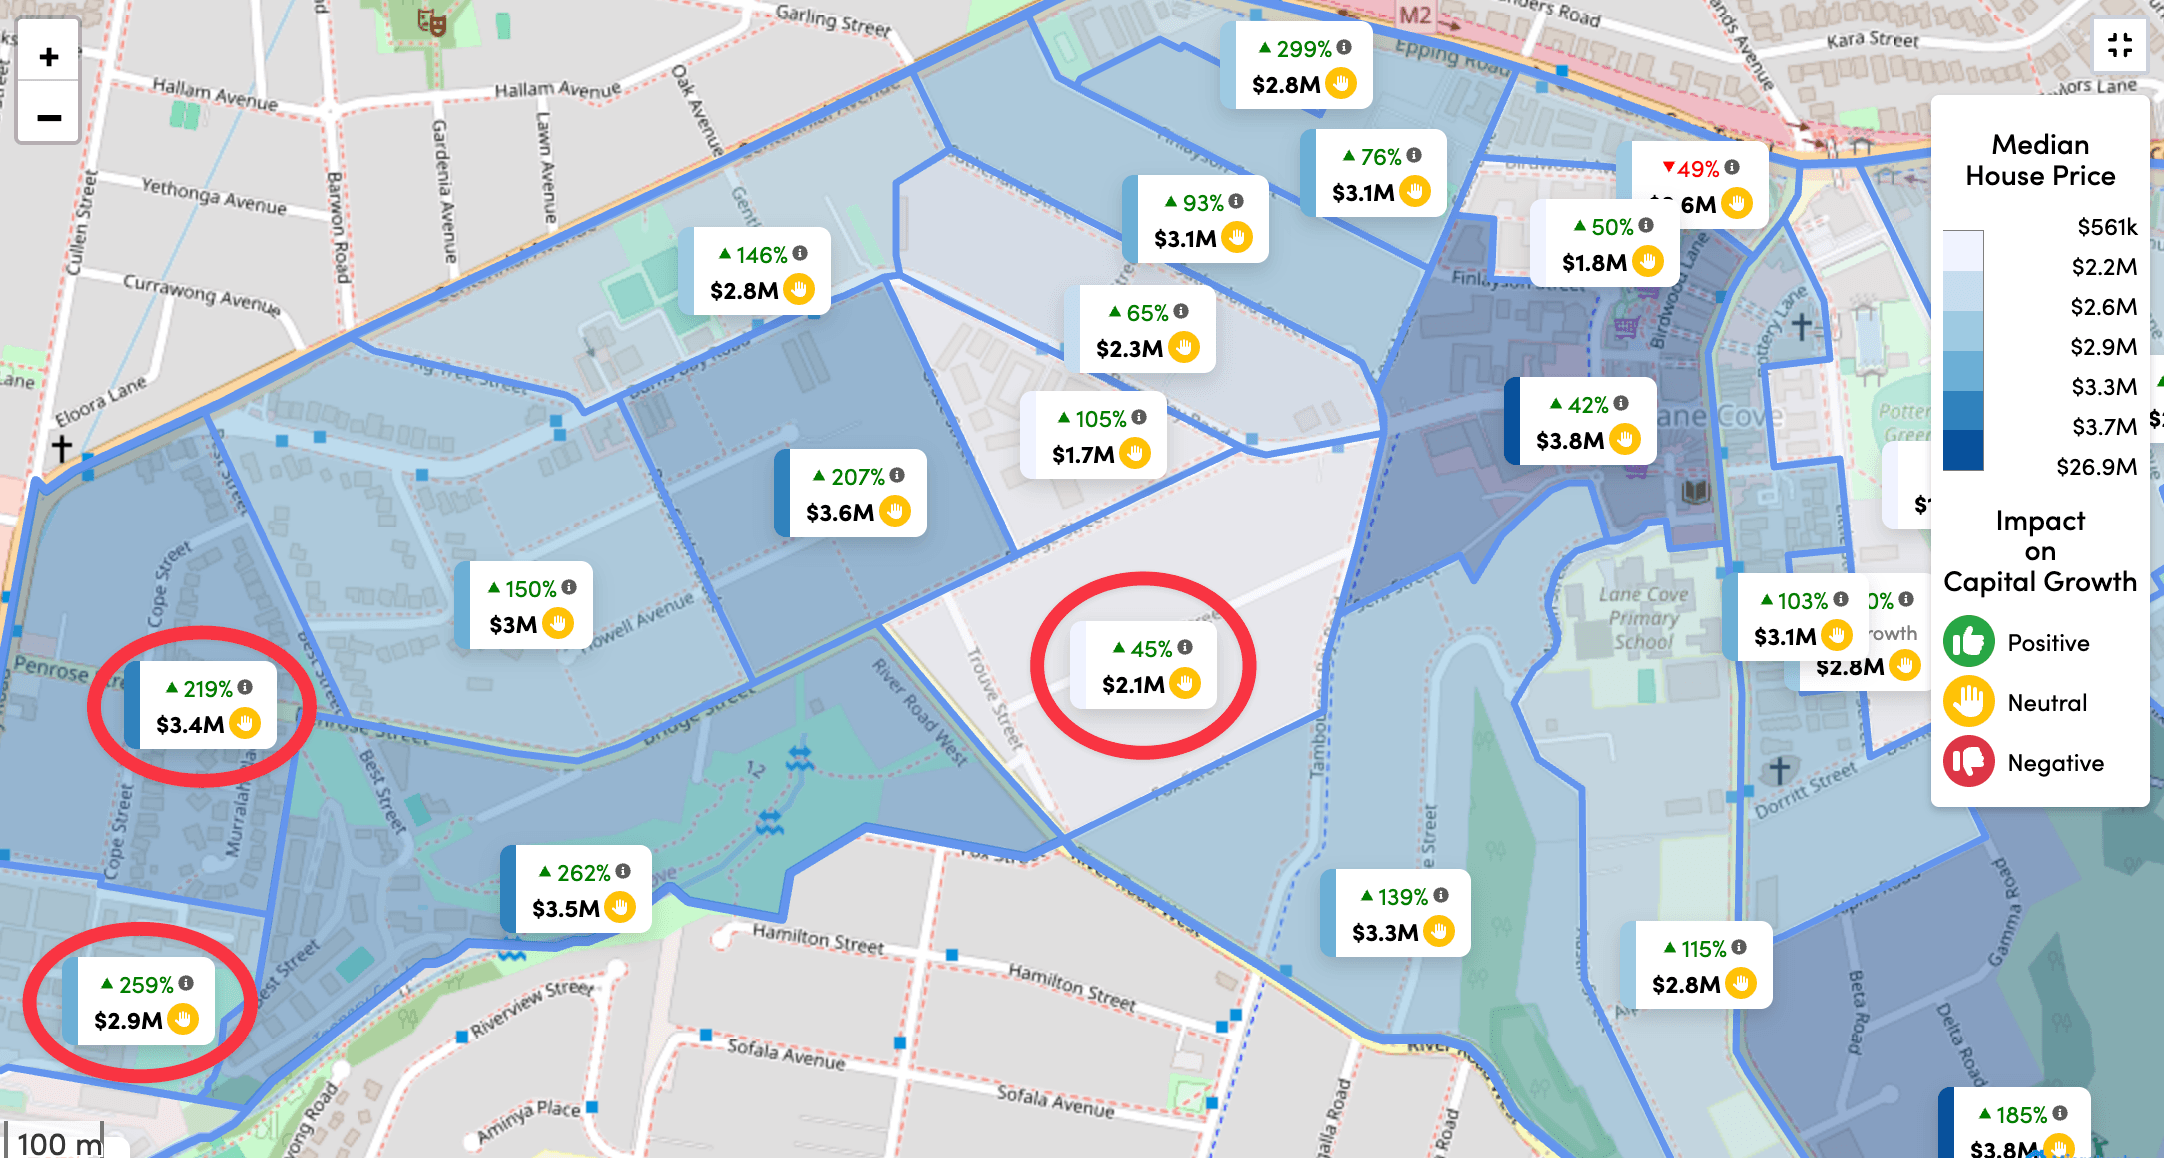
Lane Cove North: median house price and recorded ten-year growth by pocket
The map shows historical variation, not a forecast that a lower-growth pocket will catch up.
What the maps can tell us
They show where price and recorded growth have diverged within the suburb, and where a street or pocket deserves closer investigation.
What they cannot tell us
They do not establish that a lagging pocket is undervalued or must revert. Ben tests the cause of the gap against the street, property and recent like-for-like sales.
Historical pocket-analysis extract supplied August 2026. Source: Microburbs. Underlying data should be refreshed before a live acquisition decision.
What this changes
The useful opportunity is a lower price caused by something fixable while the permanent characteristics remain sound. If traffic, poor access, difficult land or another enduring issue explains the gap, the discount may be entirely justified.
The limit
Small pockets can contain few sales. Their medians can move because the mix of properties sold changed. Historical reversion is one piece of evidence, not a prediction that a pocket must catch up.
Continue through the method
Apply the method to a real property.
Bring the brief, shortlist or campaign you are weighing. Ben will explain which evidence matters, what remains uncertain and what the next decision requires.